Geodex
“Demography is destiny.”
Auguste Comte
I built Geodex to understand a country’s destiny and make better calls on investing in its markets. I couldn’t find a tool that showed demographic and economic data in one place in a format that was easy to read. I wanted a country’s full story on one screen.
You search a country, see its population and economy, then open a second country and compare the two. I’m no longer hosting it, so it’s code only now.
What it does
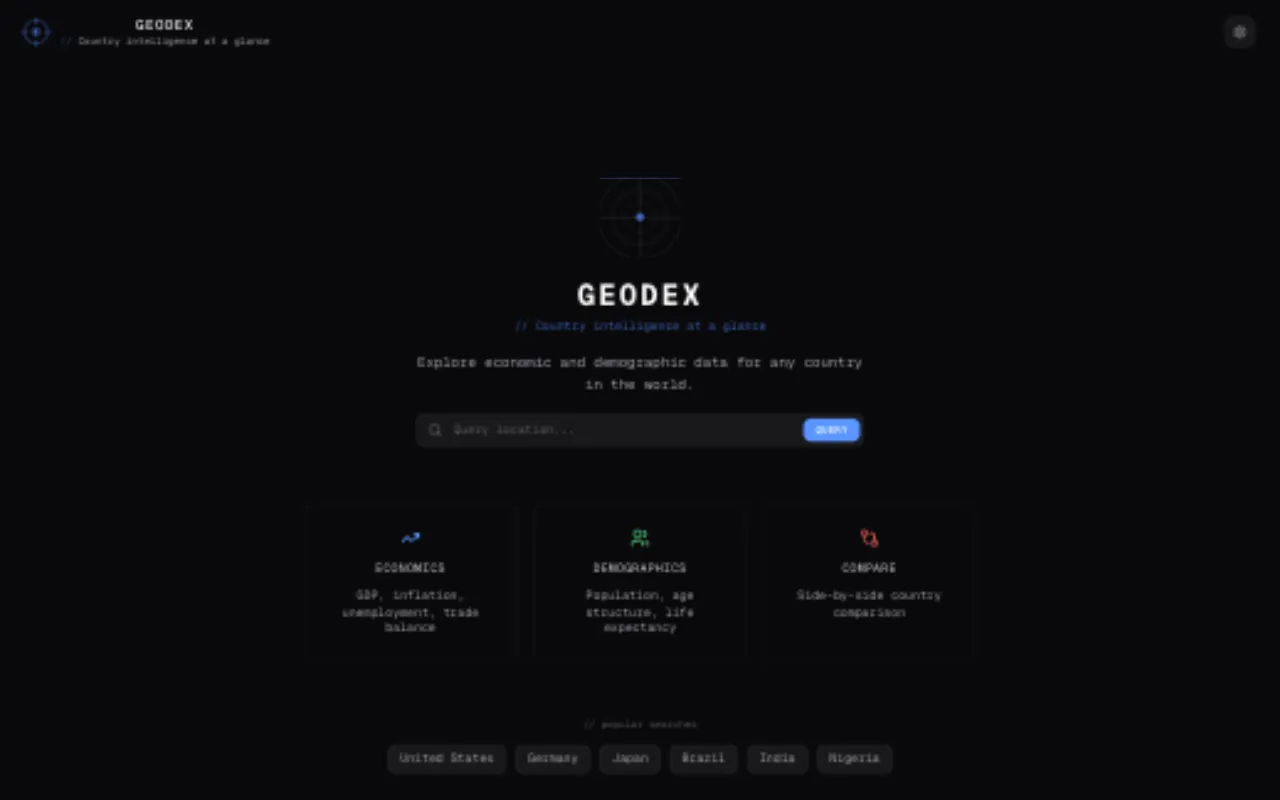
The landing page. Search a country, or jump straight in from the popular searches.
Country tabs and comparison. Each country you open becomes a tab and stays open. With two or more open, a VS pill appears on the inactive tabs. Click it and the charts overlay both countries in different colours, and the score cards show both sets of grades together.
Search. Type a country name and an autocomplete dropdown appears. Arrow keys, Enter and Escape all work, and recent searches are saved locally.
Demographic health score. Each country gets an A to F grade based on six indicators: life expectancy, infant mortality, fertility rate, median age, natural growth and dependency ratio. Each one gets a green, yellow or red light.
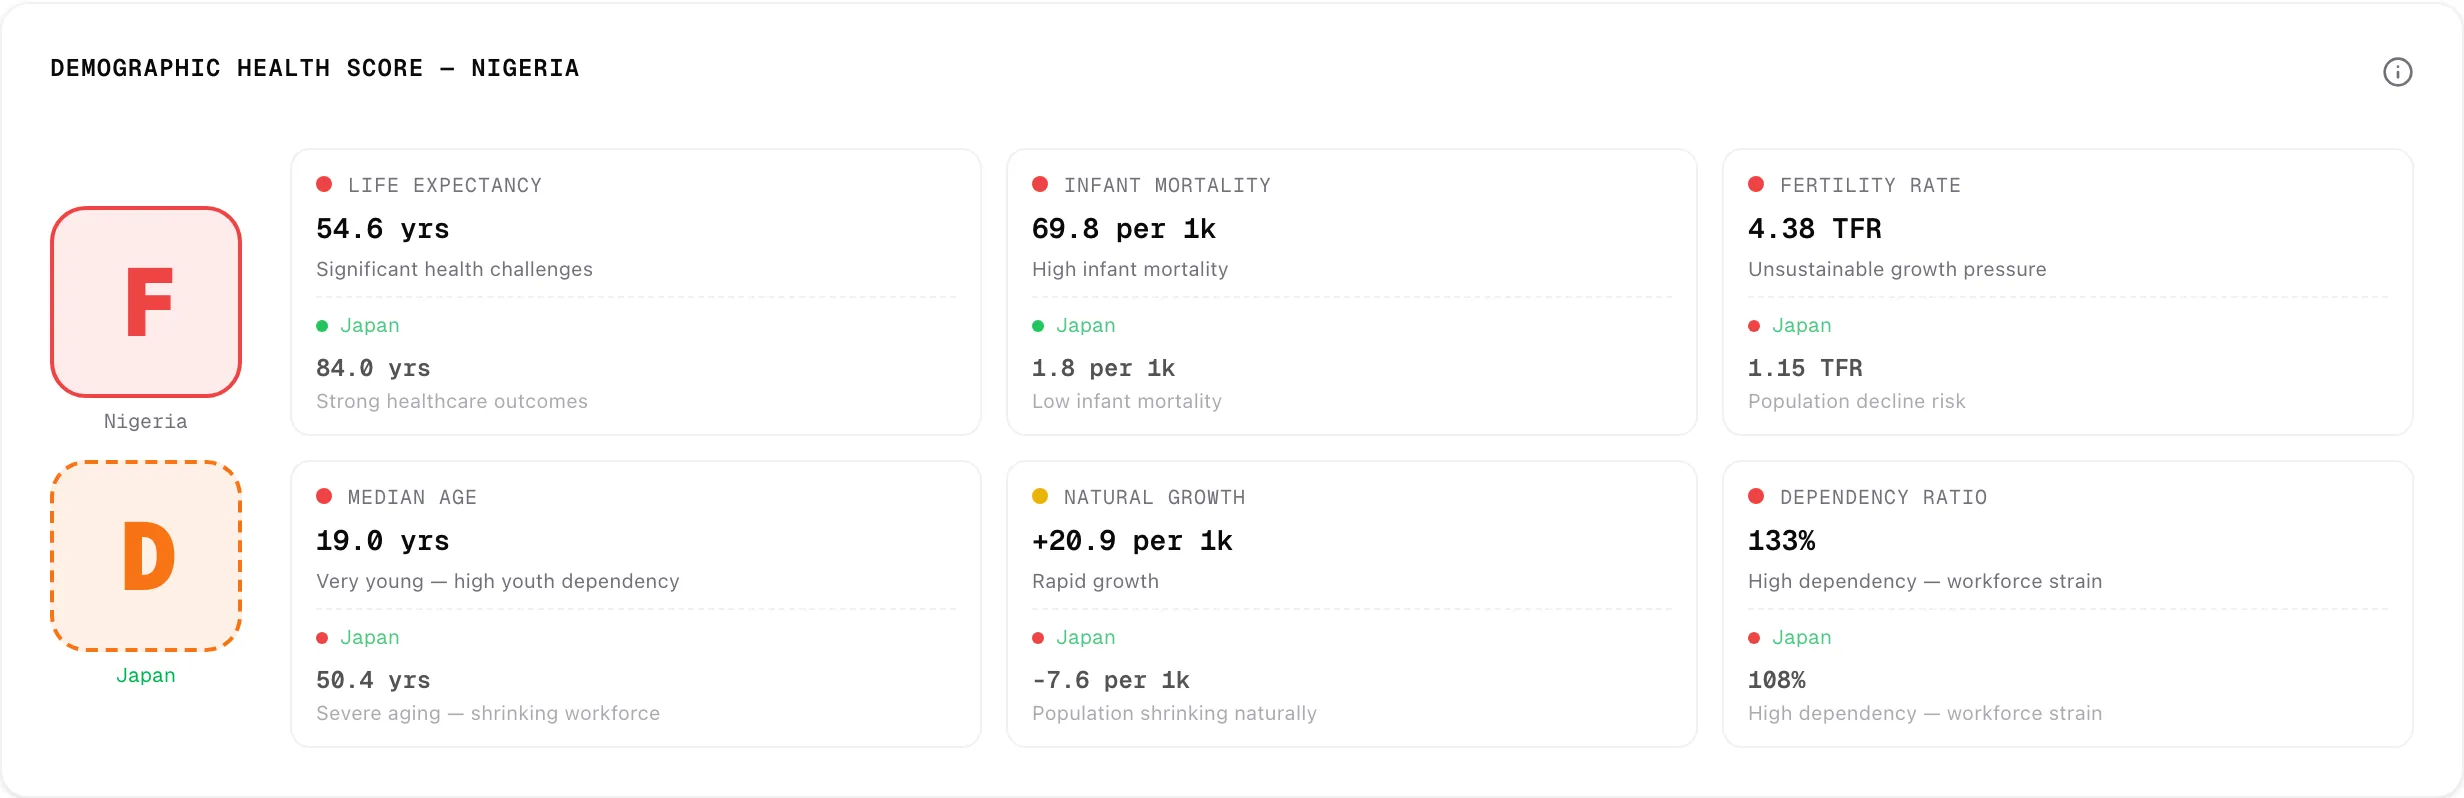
Both extremes get penalised. A fertility rate of 1.1 is just as worrying as 6.0, and the score should reflect that.
| Indicator | Healthy | Unhealthy |
|---|---|---|
| Life expectancy | 75+ years | under 65 |
| Infant mortality (per 1k) | under 10 | 30+ |
| Fertility rate | 1.8 to 2.5 | under 1.3 or 4.0+ |
| Median age | 25 to 38 | under 20 or 45+ |
| Natural growth (per 1k) | 2 to 15 | under 0 or 25+ |
| Dependency ratio | under 60% | 80%+ |
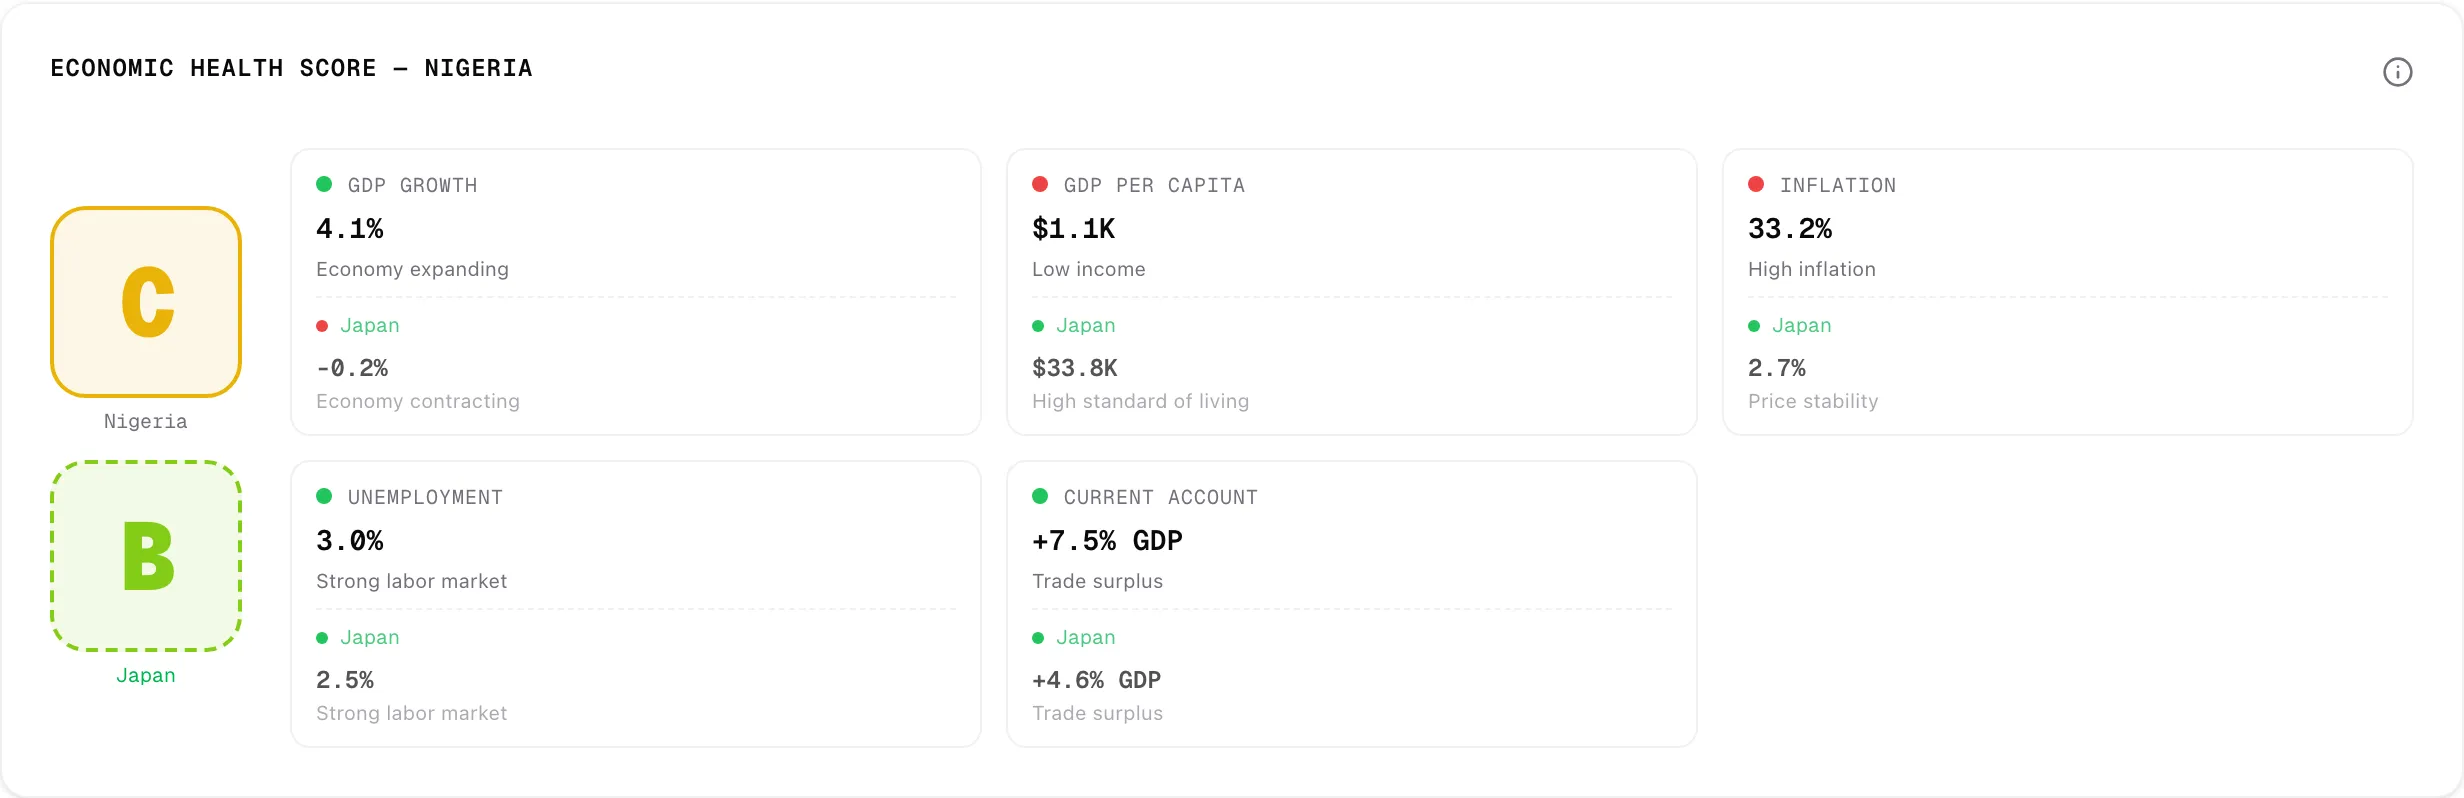
Economic health score. Same idea for the economy, with six indicators: GDP growth, GDP per capita, inflation, unemployment, public debt and current account balance. Inflation is two-sided too. Deflation is as bad a sign as runaway prices.
Charts. Under the scores are the trends behind them:
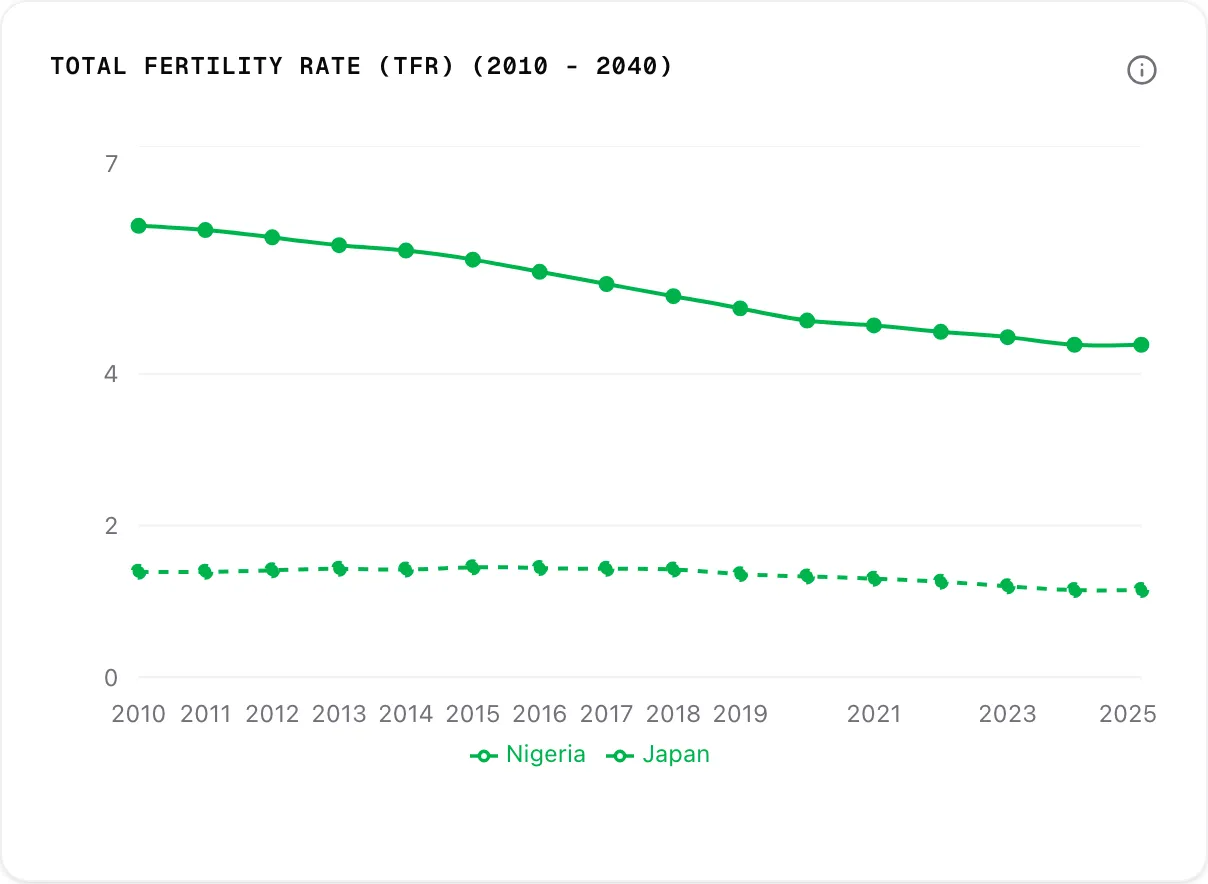
- Population: pyramid, median age, dependency ratio, sex ratio by age and density.
- Reproduction: birth and death rates, fertility, infant mortality, net migration and life expectancy.
- Economy: GDP, growth, GDP per capita, inflation and unemployment.
- Fiscal and trade: revenue vs expense, public debt and current account.
Data
Demographic data comes from the UN World Population Prospects and economic data from World Bank Open Data. Both live in a Supabase database, so the app never hits the source APIs.
A few territories only appear in one source. Western Sahara has demographic data but no World Bank economic records, for example. Those searches show partial data.
Why these indicators
For demographics I picked population pyramids, median age, dependency ratio, fertility and life expectancy, with projections out to 2040. For the economy I picked GDP, inflation, unemployment, public debt and the current account. I chose them because I thought they gave the most complete picture of a country’s health with the fewest numbers.
Under the hood
- Framework: Next.js with the App Router, and TypeScript.
- Data: Supabase.
- Charts: Recharts.
- UI: shadcn/ui and Tailwind, with next-themes for dark and light mode.
- Runtime: Bun.
I mostly picked these to learn them, and because they’re heavily used in industry right now.
Next.js. Coming from React, the learning curve was manageable. I liked the routing, server-side rendering and API routes. Honestly it was overkill for this project, but it was fun to dig into.
Supabase. Easy to go from CSV to a working database. The only snag was large datasets: I had to write Python scripts to clean and shrink the data to fit the size limit. Great for small projects. I can’t say how it scales.
Tailwind and shadcn/ui. Tailwind is my go-to. shadcn/ui is clean and easy, but it has a very specific look that will probably get boring as more sites use it.
Recharts. Fine. Nothing good or bad to say. Next time I’d try D3 for more flexible charts.
Bun. I much prefer it to Node. The toolchain is simpler, with no NVM or npm, and it has a built-in test runner. I’ve moved all my other projects over.
What went wrong
AI added technical debt. I used Claude Code to get to version 1. It was impressive at the start. But the debt built up as the project grew, and near the end it started to fail. It couldn’t make basic changes and burned a lot of tokens to reach wrong answers. Version 2 will need a big cleanup before I can add anything new.
AI was great for tedious work like components, CSS and the dashboard charts. It was weak at logic.
The data never fully joined up. The UN and World Bank datasets use different country codes, formats and coverage. Some gaps aren’t solved. Western Sahara has demographic data but no World Bank records, so searching it shows partial data. I just show nothing where the data is missing.
What I’d do differently
- Use AI as a sniper, not a shotgun. Build isolated components and layouts with it, tested in Storybook. Write the logic myself and use AI to answer questions.
- Plan the data first. Collect every dataset before building the backend, then join them into one unified schema.
- Try D3 for the charts.
Where it ends up
Version 1 works, and it taught me more about data modelling and AI tooling than about charts. If I do version 2, I’ll fix the data model first.